Mutation maps
Mutation maps are related to variant effect prediction discussed above. Mutation maps are the application of SNV variant effect prediction on every position of the input sequence with all three alternative alleles. Therefore mutation maps can only be generated for models that support variant effect prediction. Mutation maps can be used to give an overview over the effect scores in a selected region. This region may be centered on a variant of interest or any other region in the genome for which the model can produce a prediction. It is therefore complementary to the variant effect prediction functionality and is intended for use with less variants / regions of interest as the variant effect prediction itself. Typically a mutation map should be calculated for only a handful of regions or query variants (that each tag a region), because for every region many effect predictions have to calculated resulting in calculation time and memory requirements: For a single query variant / query region N = model_sequence_length * 3 * model_output_tasks * effect_scoring_functions effect predictions have to be performed.
The workflow is desinged in two steps: In a first step the aforementioned calculation is performed and results are stored in an hdf5 file with standardised format. These files can then be imported into the visualisation part of mutation maps. Both steps are available in python, R as well as the command line.
Calculating mutation maps
Python / R API
The core element of mutation maps is the MutationMap class that is instantiated with a Kipoi model object, a dataloader object and the dataloader arguments:
import kipoi
from kipoi.postprocessing.variant_effects import MutationMap

model = kipoi.get_model(<model_name>)
dataloader = model.default_dataloader
dataloader_arguments = {...}

mm = MutationMap(model, dataloader, dataloader_arguments)
MutationMap instances have the following methods to calculate mutation maps for the given query regions / variants: query_region, query_bed, query_vcf. All those functions return an instance of MutationMapPlotter, which can be stored as a hdf5 file or directly be used for generating mutation map plots.
query_region
The query_region command can be used to generate a mutation map for a selected genomic region:
mmp = mm.query_region("chr22", 25346, 25357)
The query region has to be transformed to match model input sequence length as well as it has to lie in a genomic region for which the model can produce prediction. All this is taken care of automatically just like in the score_variants function of kipoi.postprocessing.variant_effects. For more details please see below.
query_bed
The query_bed command can be used to generate mutation maps for genomic regions defined in the bed file:
mmp = mm.query_region("path/to/my/file.bed")
The query regions have to be transformed to match model input sequence length as well as they hasveto lie in a genomic region for which the model can produce prediction. All this is taken care of automatically just like in the score_variants function of kipoi.postprocessing.variant_effects. For more details please see below.
query_vcf
The query_vcf command can be used to generate mutation maps based on variants defined in the vcf file:
mmp = mm.query_vcf("path/to/my/file.vcf")
The regions for query variants are generated analogously to the score_variants function of kipoi.postprocessing.variant_effects. For more details please see below.
MutationMapPlotter
Instances of the MutationMapPlotter class are generated by the query_* methods of the MutationMap class. They contain all the effect predictions plus some additional meta data necessary to produce mutation map plots. Those objects can be stored in hdf5 files.
For plotting the plot_mutmap function can be used. The required arguments select the input sequence by a numerical index (input_entry), the name of the DNA sequence model input (model_seq_input), the name of the scoring function for which the results should be displayed (scoring_key) and finally the model output task (model_output). A combination of those four values directly link to one set of mutation map predictions.
input_entry
input_entry is a numerical index indicating which set of input data should be used. This relates back to how query regions are turned into model input data, see below. Since this link depends model sequence length as well as whether the model can only predict for a restricted subset of he genome, the meaning of an index value may vary from model to model. For a combination of models with highly different model input specifications it is therefore advisable to only query a single variant or region in order to avoid confusion.
model_seq_input
Many models will only have a single model input key, so this parameter might seem superfluous, but in general a model can have multiple DNA sequence inputs which are all being tested for variant effects.
scoring_key
The scoring key is one of the labels passed to the query_* function in the scores argument.
model_output
model_output is a model output task label.
Additional to the required arguments the plots can be generated for a subset of the model input sequence using the limit_region_genomic. The plot can be generated with reverse-complementation of the sequence by using rc_plot. There are additional features available for the python/R API which are described in the method definition, some of which are also used in the mutation_map.ipynb.
The CLI
In the CLI mutation maps can be calculated for bed files or for VCF files. Both file formats are accepted by the --regions_file argument of the CLI command:
kipoi postproc create_mutation_map <my_model_name> --dataloader_args '{...}' --regions_file path/to/my/file.vcf --output path/to/the/results/file.hdf5
Plotting
Plotting in the command line works analogously as using the python API:
kipoi postproc plot_mutation_map --input_file path/to/the/results/file.hdf5 --input_entry 0 --model_seq_input seq --scoring_key diff --model_output my_model_task --output path/to/the/plot/file.png
The meaning of the parameters is identical to the ones in the python API mentioned above. The plotting functionality in the CLI is limited to zooming into genomic region and reverse-complementation of sequences. For examaples please take a look at the mutation_map.ipynb.
Transformation of queries to model input
This section gives the necessary information to understand how the tested region is derived from a query file.
In order to perform a query on a model the query input must be transformed into genomic regions compatible with the model. Similar to variant effect prediction using the score_variants the automatically chosen region generation method will be chosen based on whether a dataloader offers a bed file input for postprocessing. dataloader.yaml > postprocessing > variant_effects > bed_input. By setting this value the mutation map method will automatically generate a temporary bed input file requesting model input for genomic regions. The path of this temporary bed file is then passed on to the dataloader by resetting the respective argument in the dataloader_arguments. For some models it is not possible to freely define the genomic region for which model input data should be generated - in that case the dataloader.yaml does not have the dataloader.yaml > postprocessing > variant_effects > bed_input set. In those cases the dataloader is executed without modifying the dataloader_arguments. The metadata generated alongside the model input is then used to identify model input that overlaps a query region / query variant.
For cases when genomic regions can be defined freely for a model, the input samples will always have to generated matching the model input sequence length. This means that for query variants a region of the length of the model input will be centered on the query variant position. For query regions (e.g.: bed input file) every region is overlapped with windows of length of the model input. The first of those regions will start at the same position as the selected query region. Regions of the length of the model input sequence length will then be generated consecutively in order to cover the full region defined by the respective query region - see this schematic:
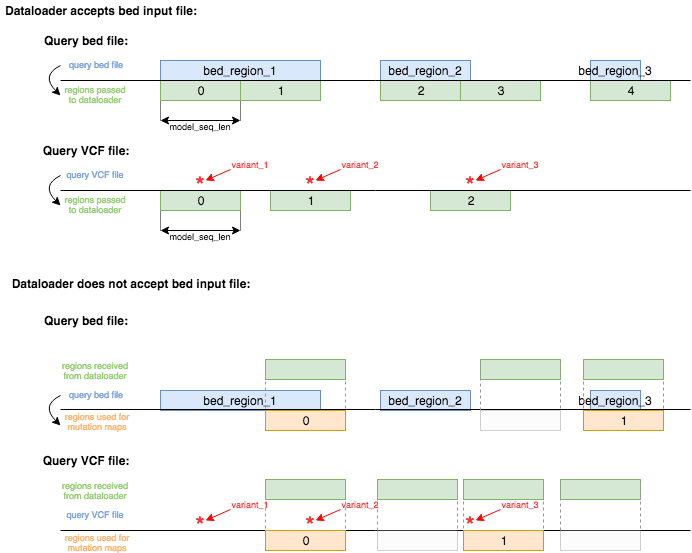
In the top bit of this schematic on can see the case in which the dataloader accepts a bed file as an input to generate
model input data. This also requires the correct setup of the dataloader.yaml in postprocessing > variant_effects > bed_input
as described in more detail (here)[../postprocessing/variant_effect_prediction]. When the dataloader doesn't support
bed input files for region defintion then all the regions generated by the dataloader will be overlapped with the query
regions and any overlapping data generated from the dataloader will be used for mutation maps. The same as for bed query
files holds true for VCF query files.
As mentioned above all of those model input sequences are the subjected to variant effect prediction for every base and ever possible allele.
The integer numbers displayed in the green or orange boxes are te order in which model input data is processed by the
mutation map calculation algorithm. The numbers represent the index by which the predictions can then be accessed for
plotting (input_entry in plot_mutmap method of MutationMapPlotter or --input_entry CLI argument).